Get delivery performance data and insight that drives action
Although all retailers (and their customers) are different, many post-purchase challenges are the same – particularly relating to getting actionable delivery performance data.

Regardless of how great your online shopping experience and customer service is, if carriers cause your packages to arrive late or damaged, it’s your brand the customer will often hold responsible.
Plus, when those ‘where is my order’ (WISMO) or ‘where is my return’ (WISMR) enquiries hit your team, the customer expects you to know the answer.
They’re issues compounded by the fact that determining delivery and carrier performance requires your teams to examine multiple systems just to keep informed about delivery and returns progress. Often, this means that when there’s a problem, it’s the customer telling you about it.
It’s all about data; the quality of it and how easily it’s accessed.
By plugging your teams and tech into the right data at the right time, the experience of the customer, and the customer service (CS) teams, are massively improved.
Do you lose time logging into multiple systems, or looking in multiple places to track deliveries?
Tracking deliveries when you use multiple carriers can feel like watching several films at the same time, on a row of TVs. It’s hard to keep track of what’s going on in each and there’s every chance you’ll miss something key in at least one of them.
Without streamlining carrier data, retailers often fall into the habit of transferring the ownership of performance insight from the internal CS team to the external carrier.
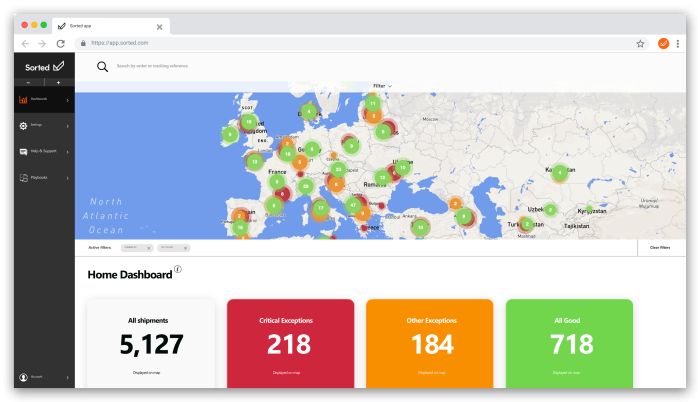
With all your data available through one post-purchase tracking partner, you should then have access to an interactive management dashboard that allows you to filter by your preferred properties, or even use metadata for deeper categorisation. This is particularly useful if you want to get granular, for example looking at just one supplier’s performance in your drop-ship model, in one place, and at the click of a button.
The right post-purchase software will also provide advanced performance reporting for customers wanting access to further insight on carrier and delivery performance or customer experience. Reports should include details like promises met or not met by carrier, visibility of trends over set periods of time, and offer the ability to dig into the detail, such as how many shipments were delivered early, on time, or after the promised date.
Other available reports should include tracking page stats and data on your webhook success rates if you are using these to pass data to other platforms. Flexible partners will also allow you to create your own reports so you get to the specific answers you need.
For your business, it means broken promises can be tracked and reduced, customer service agents are prepared for WISMO/WISMR calls, and delivery issues, carrier performance, and customer experience can be monitored via one partner – regardless of which carriers are being used.
Is getting insight on delivery performance data difficult, and historical when you do get it?
It’s as common as it is frustrating. The hours lost navigating to the right data and then making sense of it once you’re there are not hours well spent. On top of that, there’s always a concern that the data you’re using is already out of date.
Your team want (and need) to easily access and use accurate information to ensure customer delivery experience is smooth and CS operations are efficient.
You should be able to provide your teams with interactive dashboards to give them the insight they need or use webhooks to pass real-time updates to your chosen platforms, ensuring the data in your CRM, CS platform, and customer communications is as precise as possible. Not only does this put you on the front foot, allowing potential delivery issues to be dealt with before they become customer service issues, but it allows users to drill down into the data as far as needed.
It has never been easier or quicker to answer live customer enquiries or look for carrier performance detail. For your brand, it means that performance can be rigorously monitored through one partner thereby protecting that precious customer promise.
However, there is a time and place for historical data.
Having the ability to look back and analyse trends over time is invaluable when assessing longer-term performance. Post-purchase tracking software should allow you to access delivery and carrier performance and analyse trends over time.
Want to see some of the clever ways REACT customers are using data (and metadata)?

Are you only hearing about problems when the phone rings?
When a customer contacts your team, it’s rarely to tell you that you’re doing a great job. They only tend to ring when there’s a problem, and if they’re having a problem, they’re rarely happy.
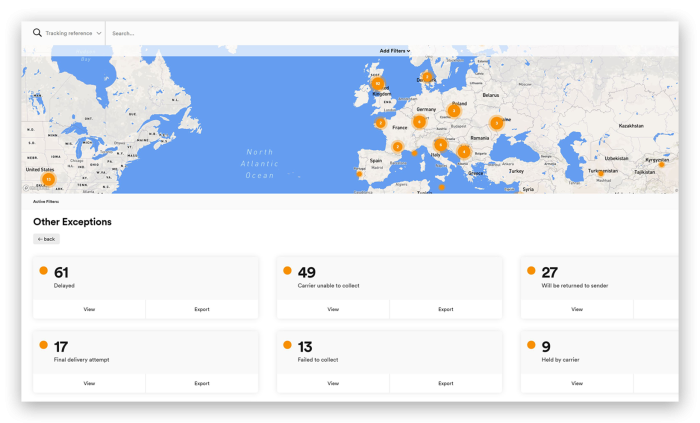
If your customer is telling you about a problem for the first time, you’re probably concerned that you’re the last to know. The key here is to discover problems before your customer does. With escalation management and alerting, you can get warnings when there’s an issue with a shipment, meaning you’ll see warnings such as ‘is late’ or ‘may be missing’.
From here, you can quickly access the information and contact the carrier to find out what’s gone wrong. This crucial capability also means you can then proactively reach out to the customer and offer a delivery update and goodwill gesture to mitigate CSAT drops. Or simply be on the front foot when the WISMO contact hits your desk.
With your customer service teams armed with the insight needed to take action, delivery or returns issues can be resolved smoothly and before they impact your CSAT / NPS scores.
From an operational perspective, this post-purchase software means WISMO/R calls can be reduced by as much as 35% and often more. One of our customers saw WISMO contacts reduce by 63% – where WISMO used to make up 40% of calls, but now make up only 15%.
Are your dashboards lacking user-friendliness, and your data difficult to navigate?
In some cases, you’d think that CS teams need a PhD in data science to manage and interpret insights. But it doesn’t have to be this way.
To accurately and proactively manage shipping statuses and issue severity across all carriers, a colour coded system can be helpful.
Through interactive dashboards – built on technology that allows teams to access carrier information, anytime, from anywhere – delivery issues are automatically classified by severity using easy-to-understand RAG (Red Amber Green) statuses.
With a smart, interactive dashboard, you can filter and slice your data to get the insight you need. Or, if you prefer to integrate with your CRM or customer service platform, you are able to do so. After all, you’ll have the quality of data and the API and webhook tools to do it.
A fully connected delivery experience
If you’re looking for actionable delivery and carrier performance data, you’re looking for REACT.

